This new feature provides you with some analytics to better understand your use of Chimpegration.
‘Insights’ can be found on the sidebar between the Template Manager and the Settings Icon and is represented by a Bar Graph Icon

At present, we offers two insights. We will seek to expand this new section over the coming year and we welcome any thoughts or opinions on what future Insights should include.
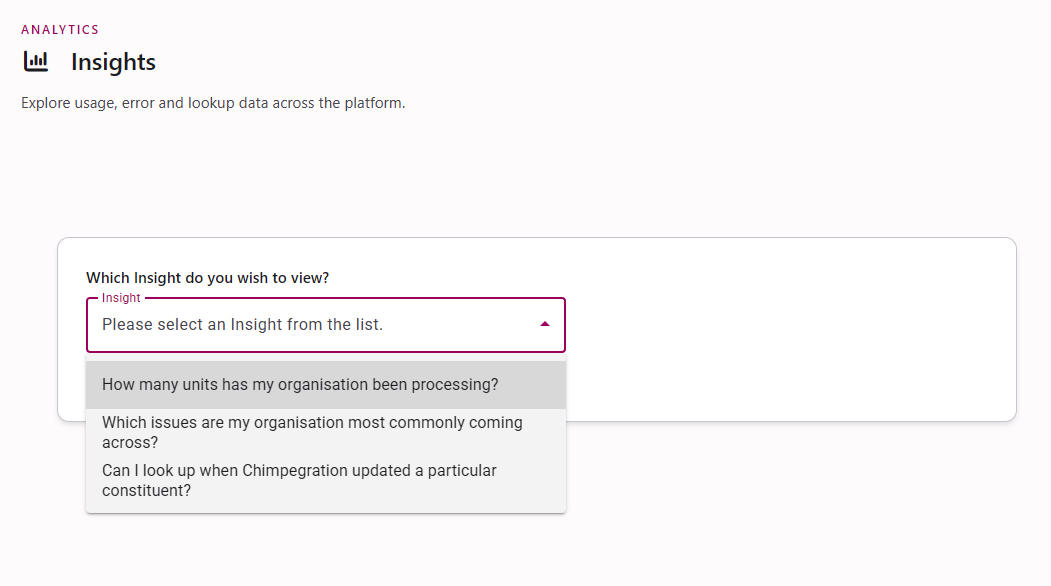
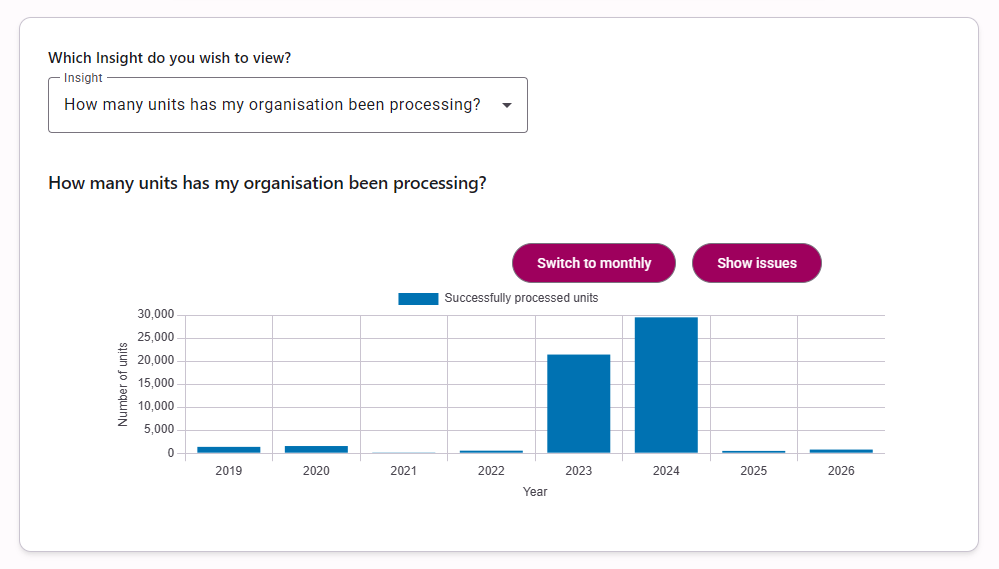
The first Insight allows you to view ‘How many units my organisation has been processing’. This insight allows you to view the number of successful and non-successful units on a monthly or yearly basis in a graphical form as. This graph can help you in identifying trends or issues and can aid in understanding future spends.
You can filter the graph to show ‘All Years’ or a specific year as well as switch it from showing the Number of Units Processed on a monthly or yearly basis.
Finally, you can also toggle it to include ‘Issues’ or only show Successfully processed units.
To understand the nature of the issues, please look to review your Completed Processes (the Check Box on the sidebar)
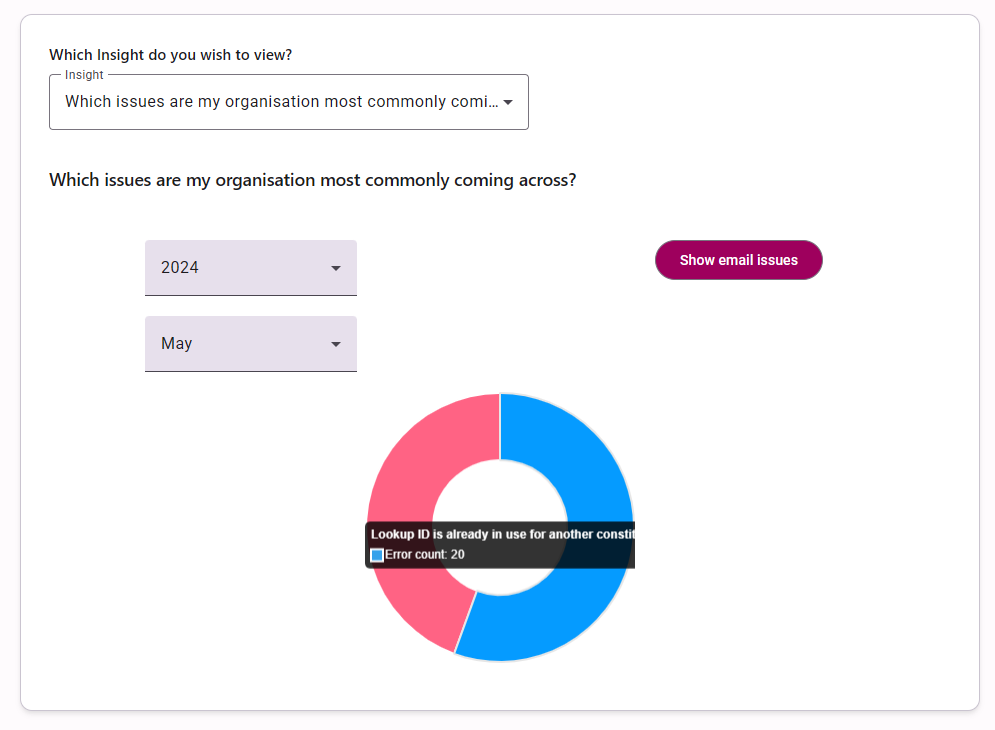
The second is a pie chart that shows ‘Which issues are my organisation most commonly coming across?’ Again, you can filter by year and month. Hovering over each section with you mouse pointer will reveal the issue and the error count
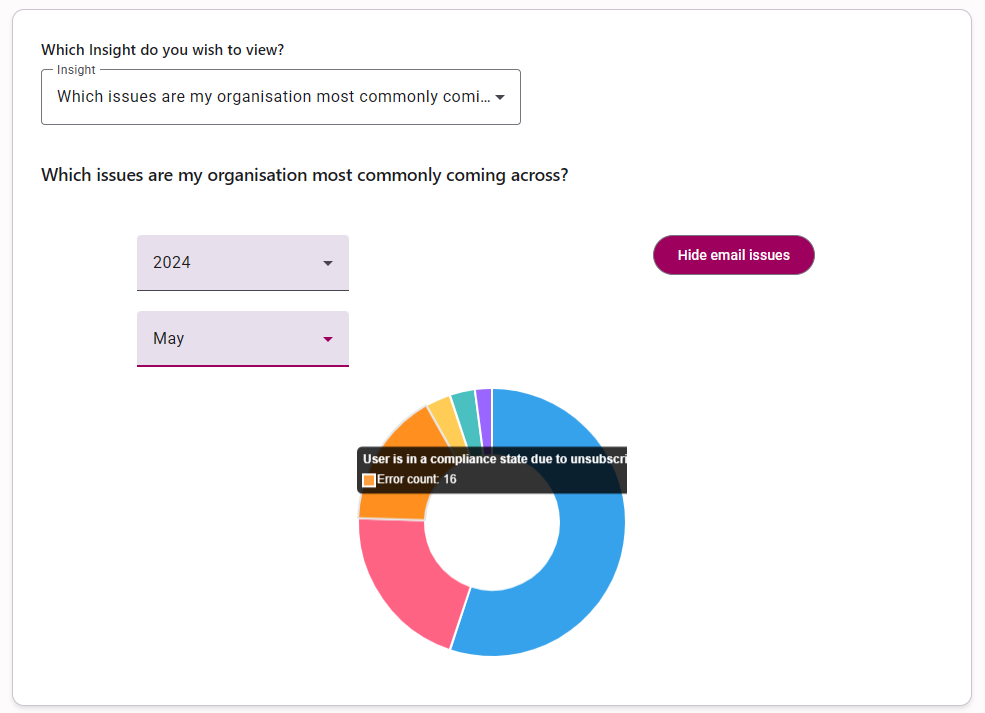
Since you cannot segment your RE NXT list to exclude records without an email address, it is quite common for records to be rejected into Mailchimp because they do not have an email address. We have found this issue can often greatly overshadow other common issues, so we have provided an option to remove ‘no email address’ issue from the reports.
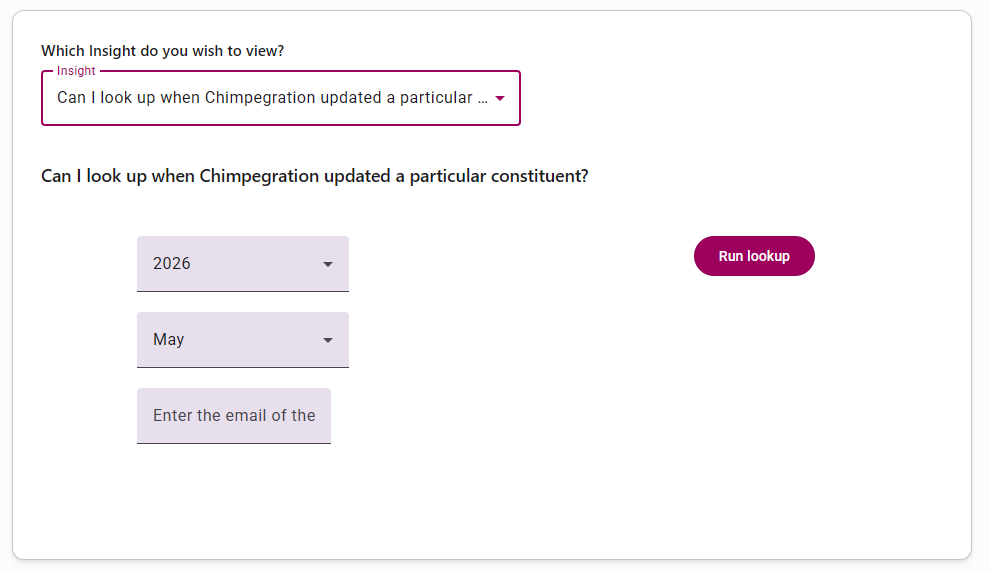
You can also explore when Chimpegration updated a particular constituent.